Meet Nano Banana Pro
Nano Banana Pro (officially known as Gemini 3 Pro Image) is Google DeepMind's most advanced image generation and editing model. This revolutionary AI system brings studio-quality precision, exceptional text rendering, and deep world knowledge to image creation, making it the go-to choice for professionals and creators worldwide.
Built on the powerful Gemini 3 Pro foundation, Nano Banana Pro represents a quantum leap in AI-powered creativity. Whether you're designing marketing materials, creating educational infographics, or bringing your wildest imaginations to life, this model delivers unprecedented control and quality.
🍌 Nano Banana
Gemini 2.5 Flash Image
- ⚡ Fast & cost-effective
- 🎨 Great for quick creativity
- 🔄 Character consistency
- 📸 Multi-image blending
- 💰 $0.039 per image
🍌✨ Nano Banana Pro
Gemini 3 Pro Image
- 🎯 Studio-quality precision
- 📝 Advanced text rendering
- 🌍 Robust world knowledge
- 🔬 Grounding with Google Search
- 🎬 Professional-grade control
What Makes It Revolutionary?
📝 Perfect Text Rendering
Generate crystal-clear, legible text directly in images across multiple languages. Perfect for posters, mockups, and multilingual content.
🎨 Studio-Quality Control
Exercise fine control over lighting, camera angles, focus, color grading, and composition for professional results every time.
🌍 Deep World Knowledge
Leverages Gemini's extensive understanding to create factually accurate representations, from biological diagrams to historical scenes.
🔍 Google Search Grounding
When enabled, connects to real-time web content for data-driven, up-to-date visual outputs.
✏️ Advanced Editing
Masked editing, lighting transformations, multi-image blending, and iterative refinement with natural language.
🎭 Character Consistency
Maintain the same character appearance across multiple images for storytelling and brand assets.
Example 1: Comic Creation : Getting started with Nano Banana Pro
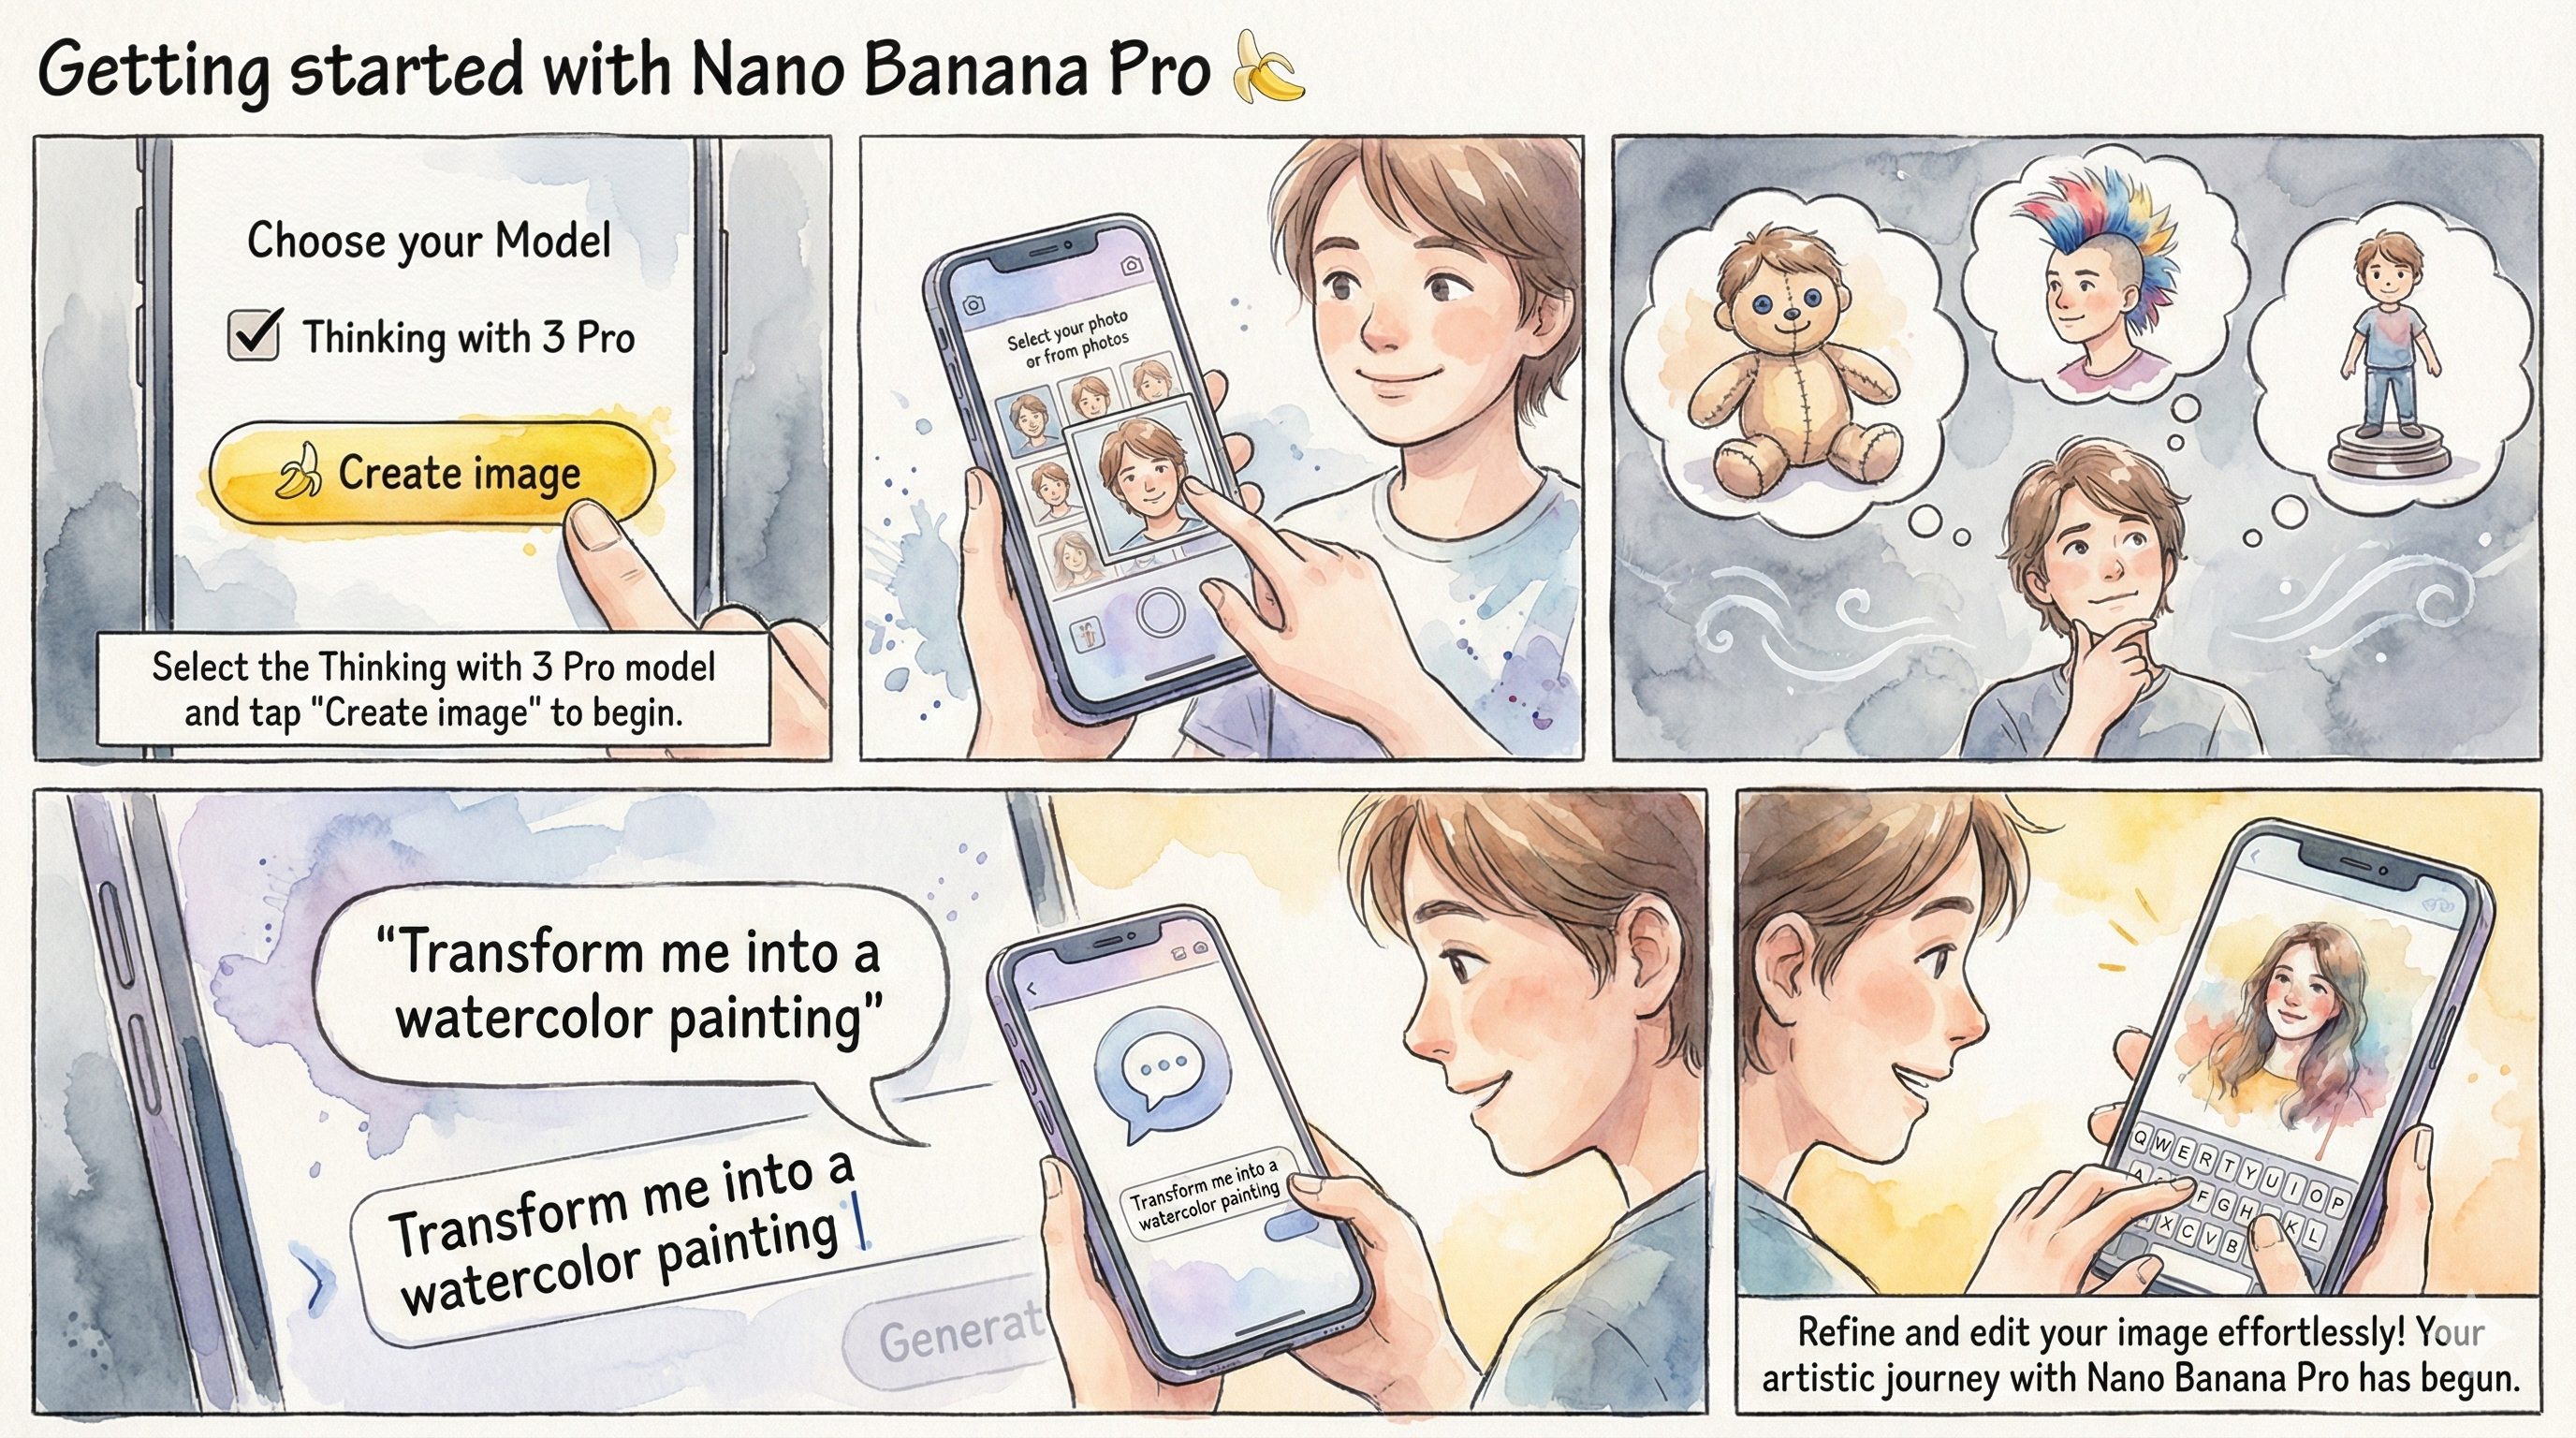
📝 Click to View Detailed Prompt
Example 2: Elegant Multilingual Restaurant Menu
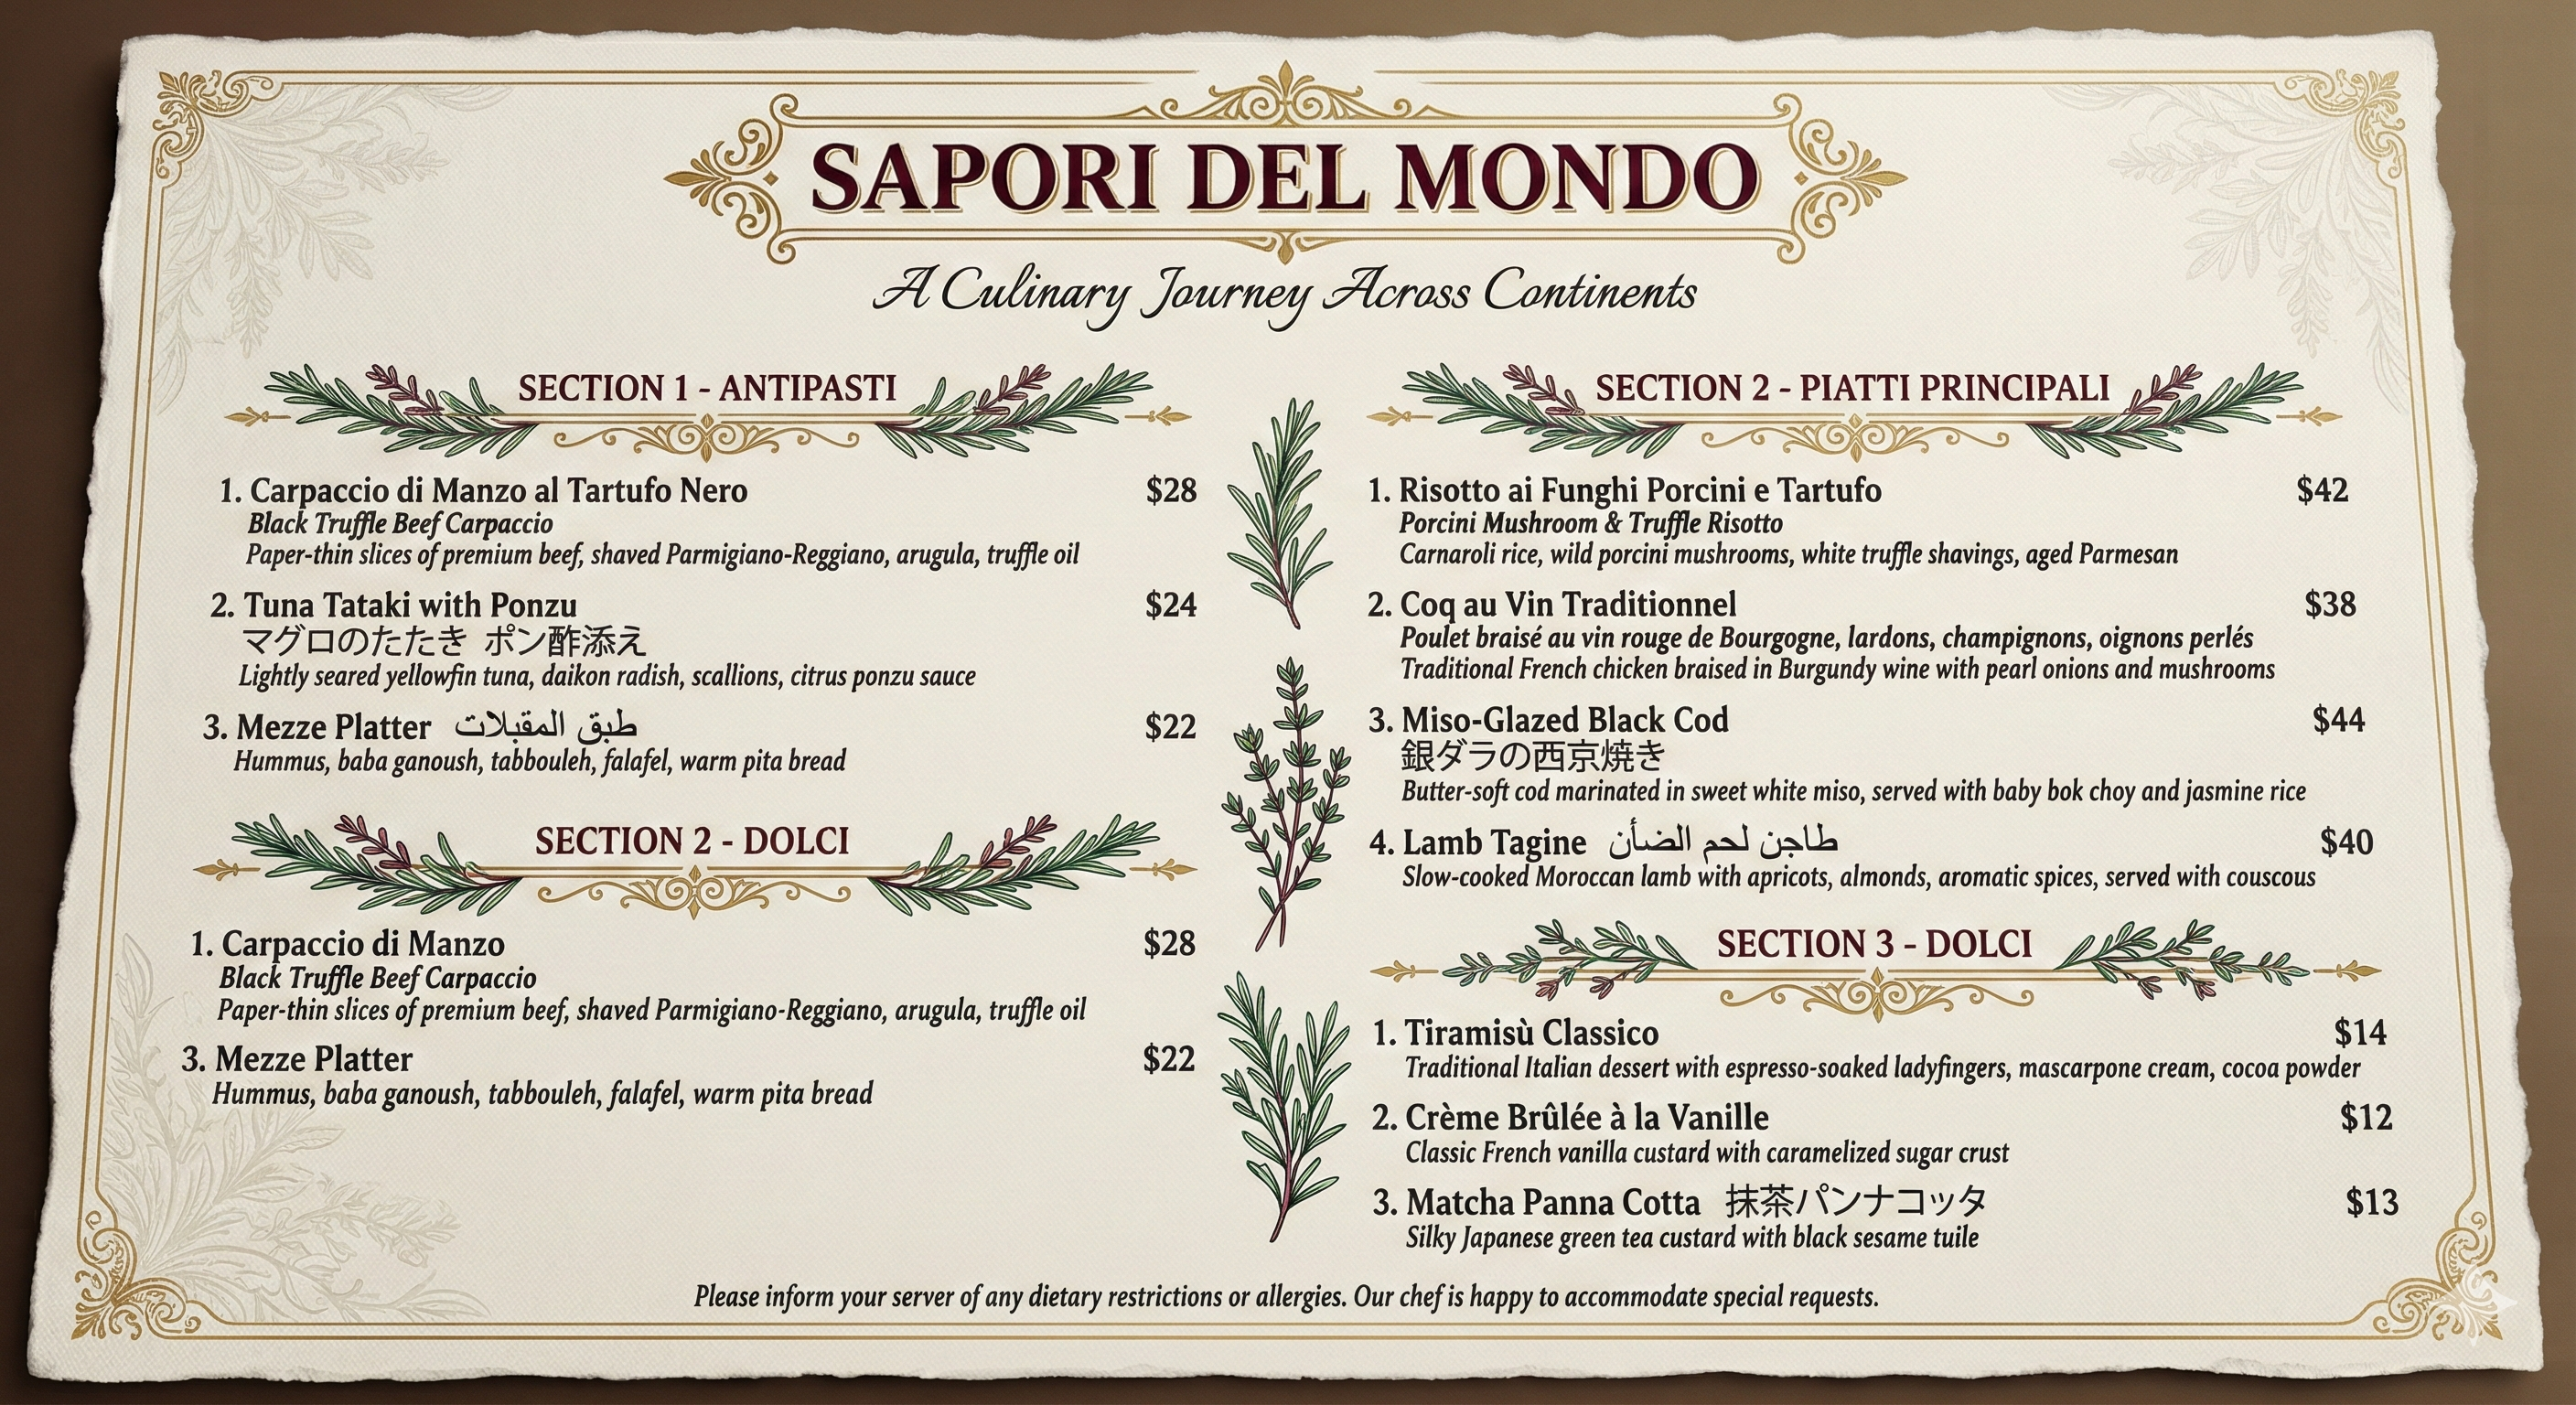
📝 Click to View Detailed Prompt
Example 3: Detailed Architectural Floor Plan
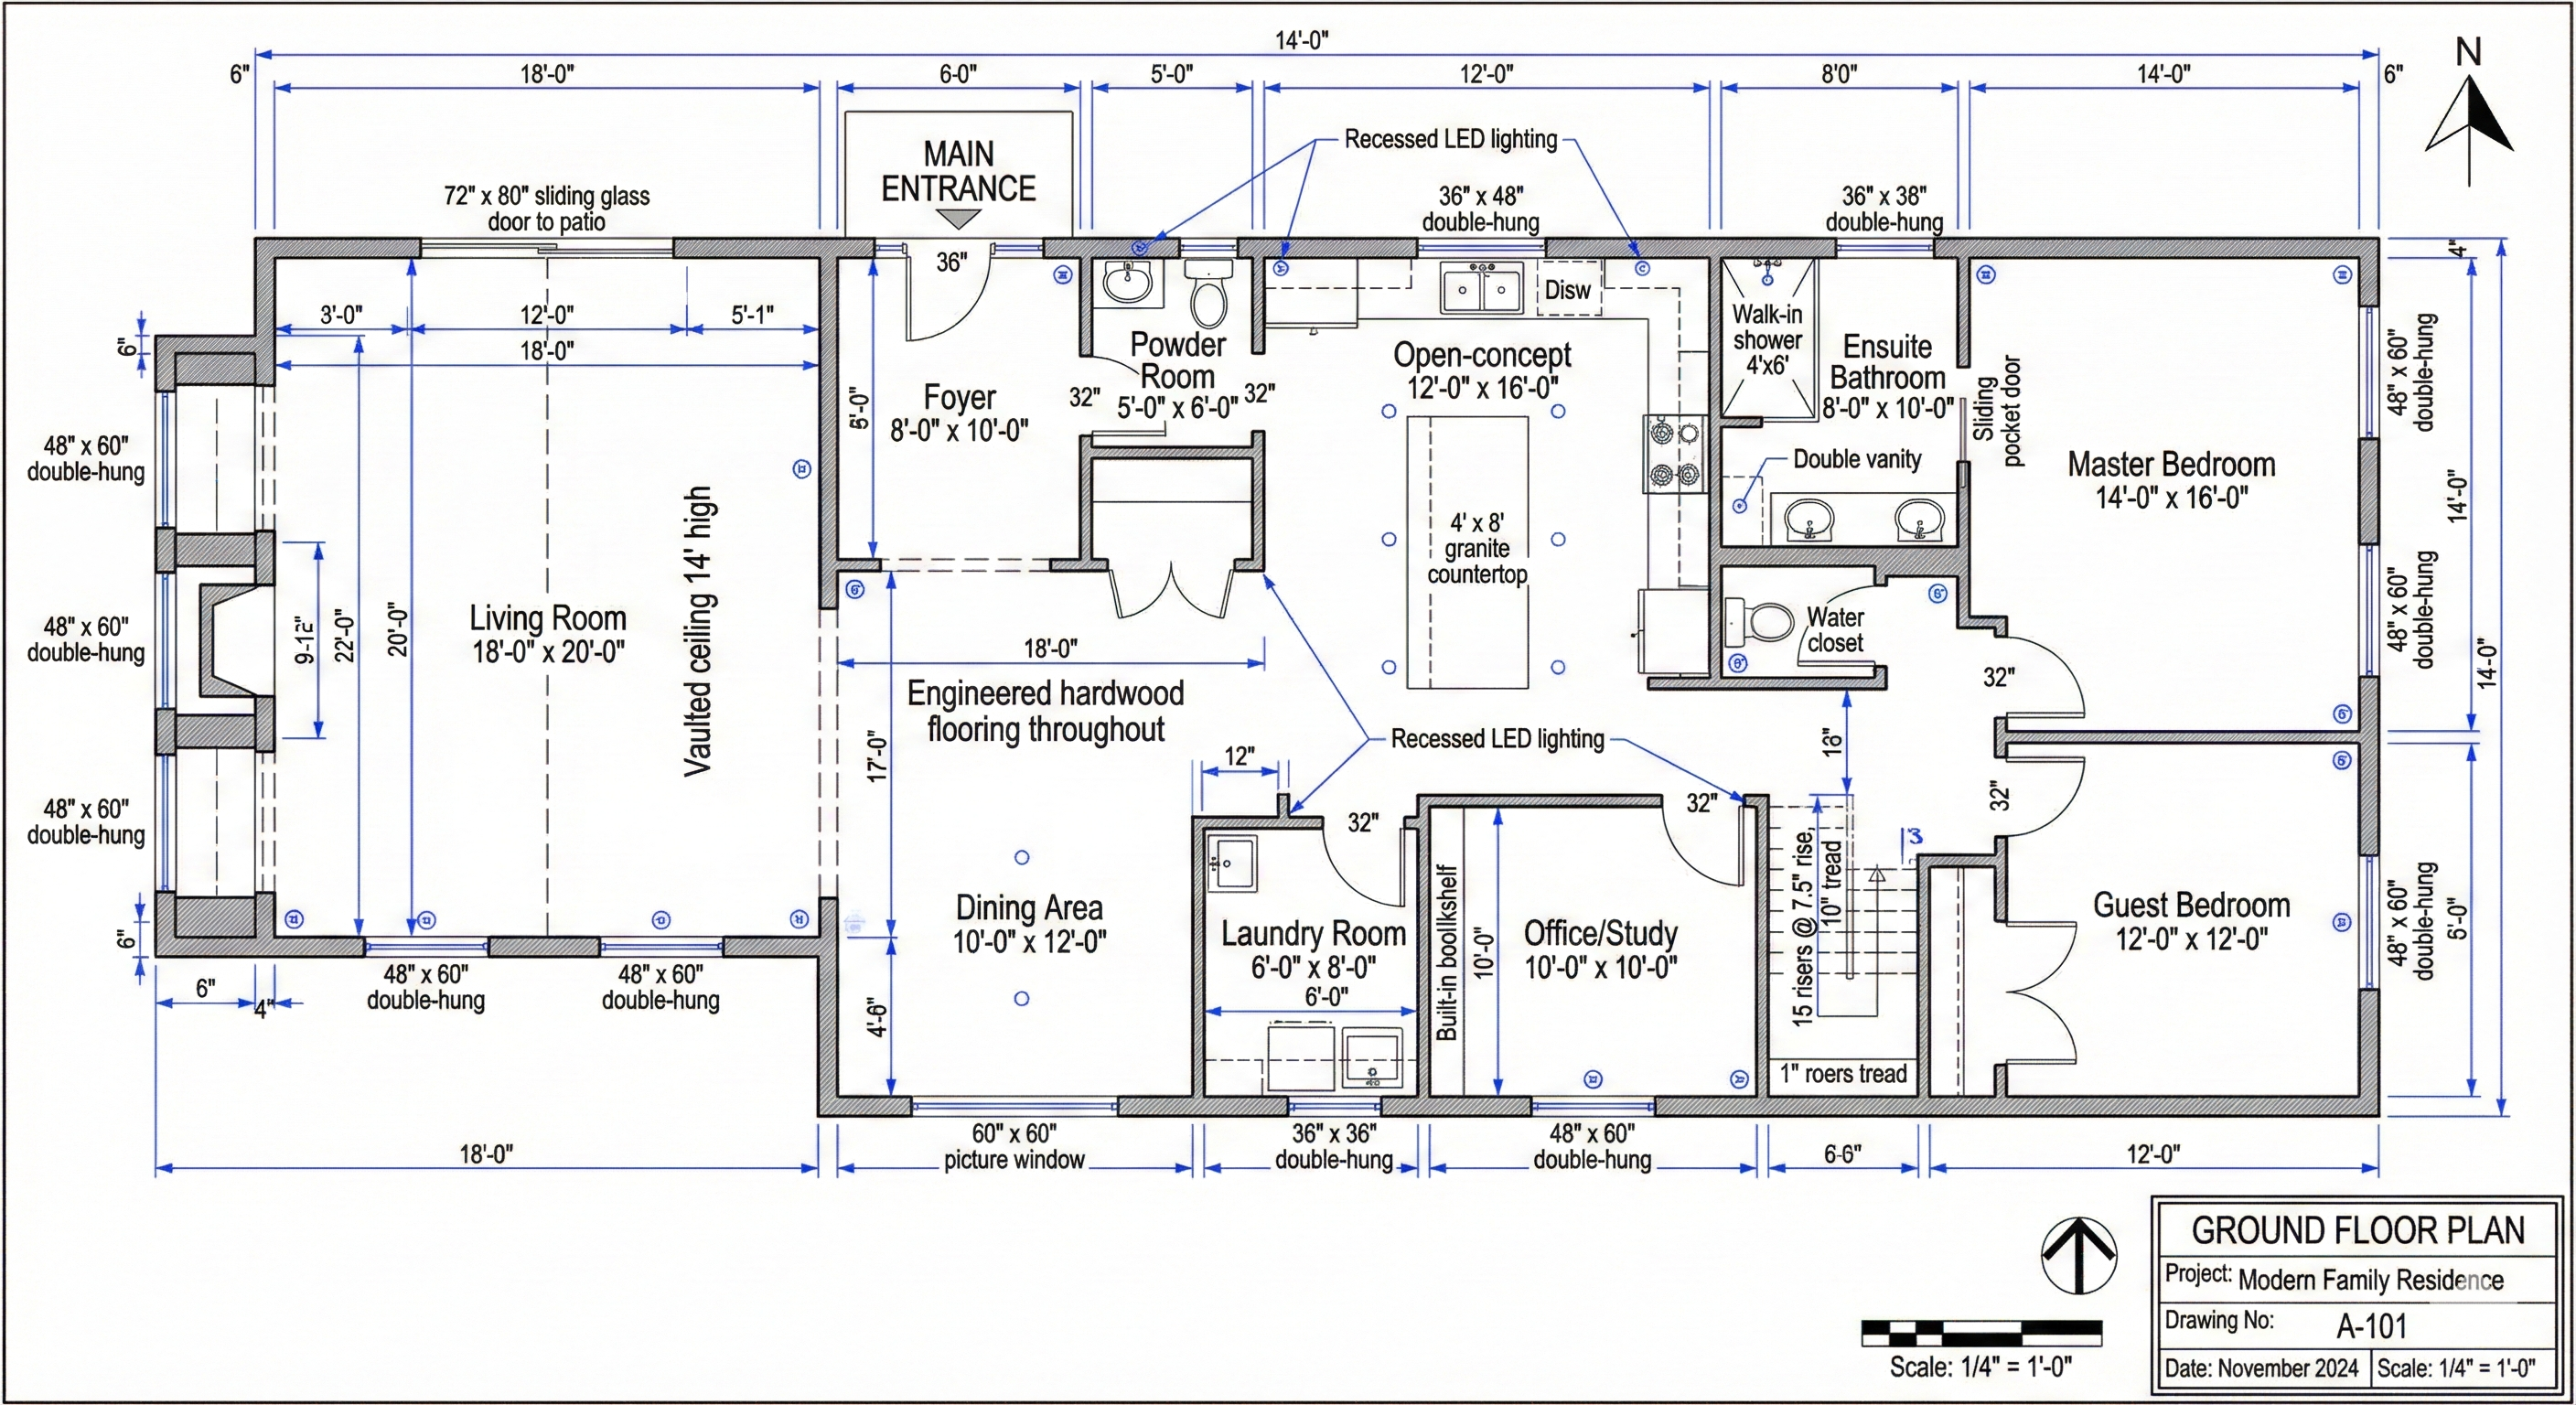
📝 Click to View Detailed Prompt
Example 4: Quantum Computing Circuit Diagram
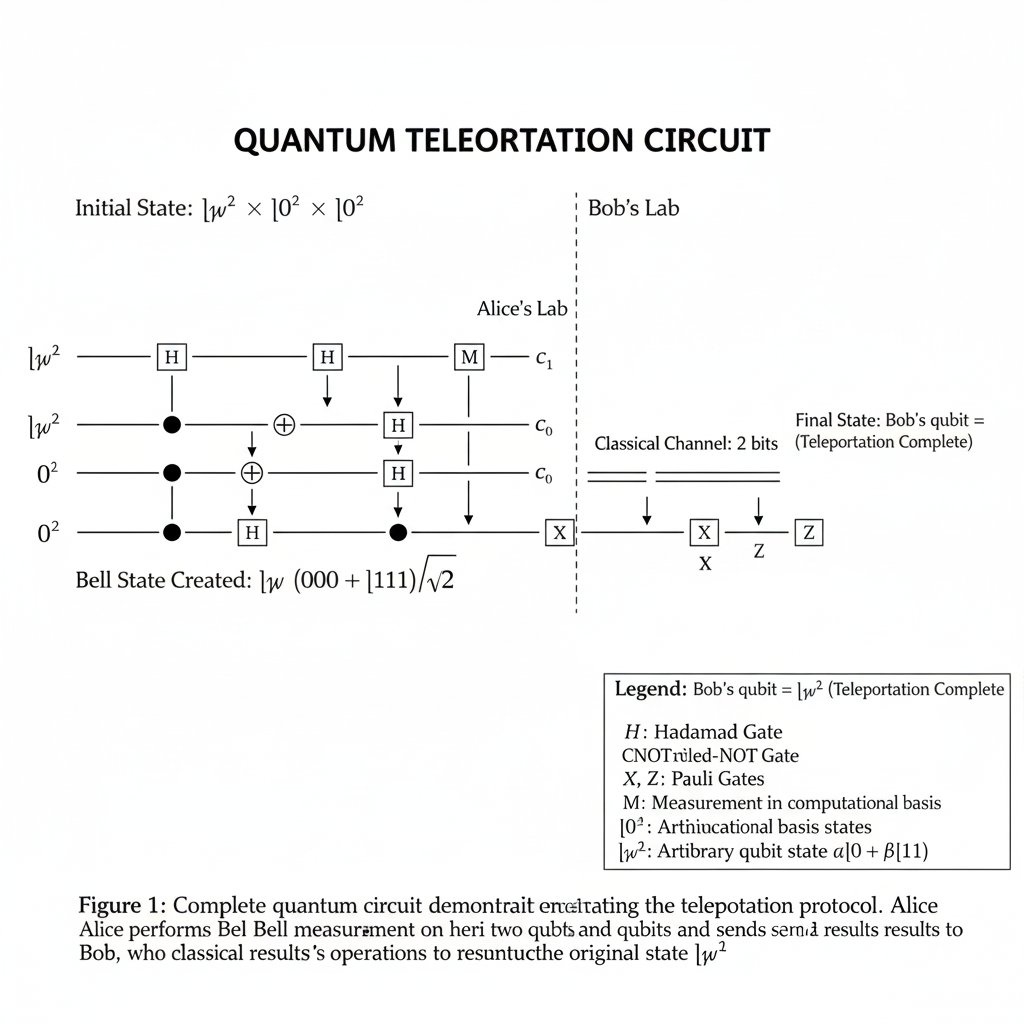
📝 Click to View Detailed Prompt
Example 5: Climate Change Data Visualization Infographic
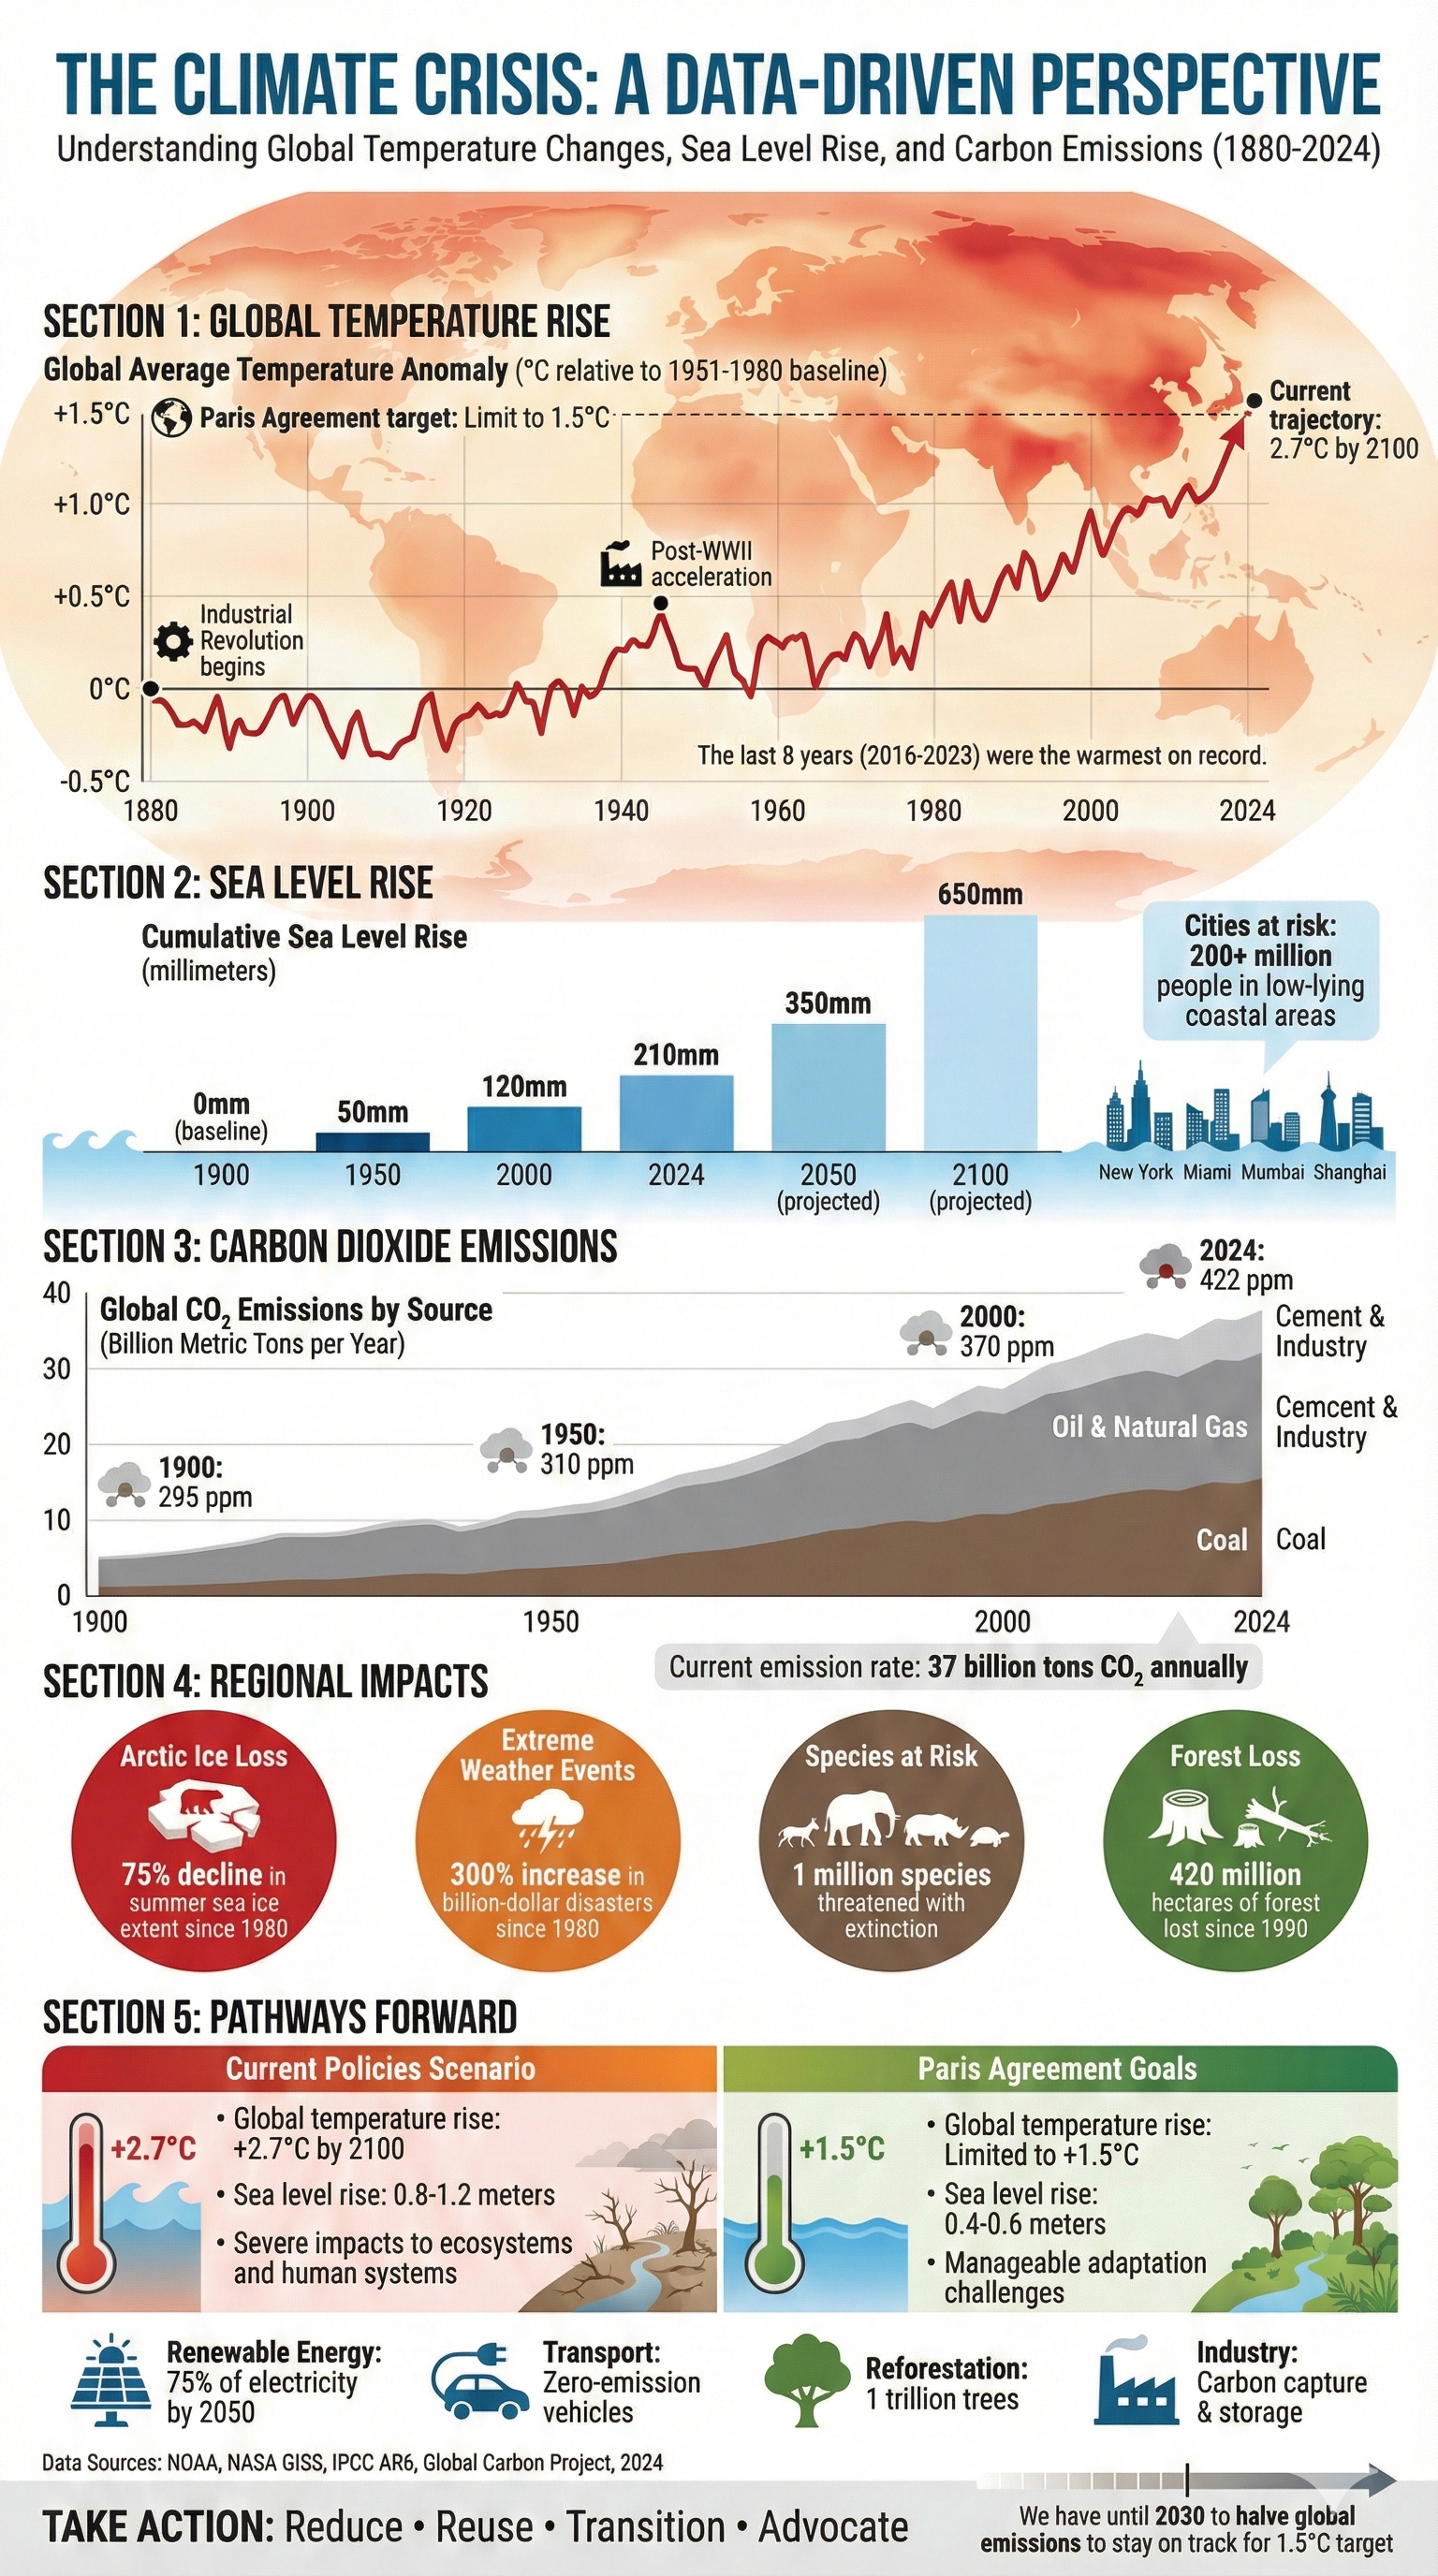
Testing: Comprehensive climate data visualization with multiple charts (line graph, bar chart, area chart), 50+ data labels, statistical annotations, legends, and complex visual hierarchy 🌍📊
📝 Click to View Detailed Prompt
🚀 Powered by Gemini 3 Pro
Nano Banana Pro leverages the full power of Google's Gemini 3 Pro model, which brings:
- Advanced Language Understanding: Captures nuance and depth in your prompts
- Multimodal Processing: Seamlessly works with text and image inputs together
- Real-world Reasoning: Applies logic and world knowledge to generate accurate visuals
- Iterative Intelligence: Understands context from previous generations for consistent results
- SynthID Watermarking: Every image includes invisible digital watermarks for identification
Conclusion
Nano Banana Pro represents the cutting edge of AI image generation. With its exceptional text rendering capabilities, deep world knowledge, multilingual support, and studio-quality control, it's transforming how professionals create visual content.
These 5 advanced examples demonstrate the model's ability to handle:
- Complex technical diagrams with precise notation
- Multilingual content with perfect character rendering
- Detailed data visualizations with multiple chart types
- Professional-grade layouts with sophisticated typography
- Intricate compositions with 50+ text elements
Ready to go bananas with AI? Try these prompts in Nano Banana Pro and experience the future of image creation! 🍌✨🎨